20
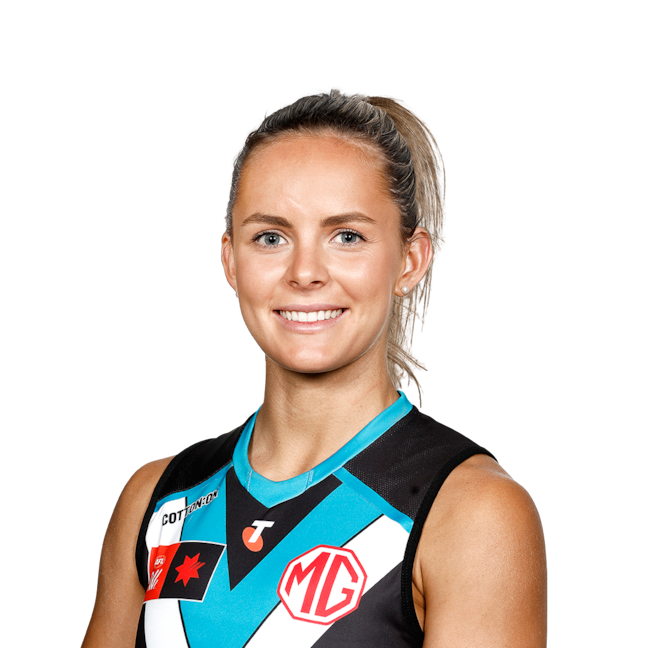
Sachi
Syme
Per Game Averages
| Year | Season | Club | Games | ToG (%) | K | H | D | DE (%) | M | T | HO | FF | FA | CLR | MG | GAs | G | B | FA |
|---|---|---|---|---|---|---|---|---|---|---|---|---|---|---|---|---|---|---|---|
| 2025 | 10 | PORT | 12 | 77.1 | 10.0 | 2.6 | 12.6 | 58.9 | 2.4 | 1.8 | 0.0 | 0.4 | 0.7 | 0.8 | 257.4 | 0.0 | 0.0 | 0.0 | 48.2 |
| 2024 | 9 | PORT | 13 | 70.7 | 7.0 | 2.0 | 9.0 | 47.9 | 1.4 | 3.4 | 0.0 | 1.0 | 0.9 | 1.6 | 157.4 | 0.1 | 0.1 | 0.2 | 41.5 |
| 2023 | 8 | PORT | 8 | 67.6 | 4.1 | 3.0 | 7.1 | 56.1 | 0.9 | 3.0 | 0.0 | 0.8 | 1.0 | 1.1 | 138.4 | 0.0 | 0.0 | 0.1 | 30.9 |
| 2022 | 7 | PORT | 8 | 60.0 | 3.1 | 2.2 | 5.4 | 60.5 | 1.4 | 1.2 | 0.0 | 0.2 | 0.5 | 0.4 | 60.6 | 0.1 | 0.1 | 0.1 | 22.6 |
| Career averages | 41 | 69.9 | 6.6 | 2.4 | 9.0 | 55.1 | 1.6 | 2.4 | 0.0 | 0.6 | 0.8 | 1.0 | 164.1 | 0.0 | 0.0 | 0.1 | 37.7 | ||
Totals
| Year | Season | Club | Games | K | H | D | M | T | HO | FF | FA | CLR | MG | GAs | G | B | FA |
|---|---|---|---|---|---|---|---|---|---|---|---|---|---|---|---|---|---|
| 2025 | 10 | PORT | 12 | 120 | 31 | 151 | 29 | 22 | 0 | 5 | 8 | 9 | 3089 | 0 | 0 | 0 | 578 |
| 2024 | 9 | PORT | 13 | 91 | 26 | 117 | 18 | 44 | 0 | 13 | 12 | 21 | 2046 | 1 | 1 | 2 | 540 |
| 2023 | 8 | PORT | 8 | 33 | 24 | 57 | 7 | 24 | 0 | 6 | 8 | 9 | 1107 | 0 | 0 | 1 | 247 |
| 2022 | 7 | PORT | 8 | 25 | 18 | 43 | 11 | 10 | 0 | 2 | 4 | 3 | 485 | 1 | 1 | 1 | 181 |
| Career totals | 41 | 269 | 99 | 368 | 65 | 100 | 0 | 26 | 32 | 42 | 6727 | 2 | 2 | 4 | 1546 | ||
Home/Away Per Game
| Club | Games | ToG (%) | K | H | D | DE (%) | M | T | HO | FF | FA | CLR | MG | GAs | G | B | FA | |
|---|---|---|---|---|---|---|---|---|---|---|---|---|---|---|---|---|---|---|
| PORT | Home | 22 | 69.3 | 6.5 | 2.6 | 9.1 | 57.2 | 1.6 | 2.6 | 0.0 | 0.8 | 0.9 | 1.2 | 167.2 | 0.1 | 0.0 | 0.0 | 38.8 |
| PORT | Away | 19 | 70.6 | 6.6 | 2.2 | 8.8 | 52.7 | 1.5 | 2.2 | 0.0 | 0.5 | 0.7 | 0.8 | 160.5 | 0.0 | 0.1 | 0.2 | 36.5 |
Finals Per Game
| Year | Season | Club | Games | ToG (%) | K | H | D | DE (%) | M | T | HO | FF | FA | CLR | MG | GAs | G | B | FA |
|---|---|---|---|---|---|---|---|---|---|---|---|---|---|---|---|---|---|---|---|
| 2024 | 9 | PORT | 13 | 70.7 | 7.0 | 2.0 | 9.0 | 47.9 | 1.4 | 3.4 | 0.0 | 1.0 | 0.9 | 1.6 | 157.4 | 0.1 | 0.1 | 0.2 | 41.5 |
| Career averages | 13 | 70.7 | 7.0 | 2.0 | 9.0 | 47.9 | 1.4 | 3.4 | 0.0 | 1.0 | 0.9 | 1.6 | 157.4 | 0.1 | 0.1 | 0.2 | 41.5 | ||
Game highs
| Year | Season | Club | Games | ToG (%) | K | H | D | DE (%) | M | T | HO | FF | FA | CLR | MG | GAs | G | B | FA |
|---|---|---|---|---|---|---|---|---|---|---|---|---|---|---|---|---|---|---|---|
| 2025 | 10 | PORT | 12 | 86.0 | 17 | 6 | 21 | 85.7 | 5 | 4 | 0 | 1 | 3 | 2 | 368 | 0 | 0 | 0 | 80 |
| 2024 | 9 | PORT | 13 | 85.0 | 16 | 4 | 18 | 100.0 | 3 | 7 | 0 | 4 | 2 | 6 | 330 | 1 | 1 | 2 | 83 |
| 2023 | 8 | PORT | 8 | 76.0 | 9 | 8 | 13 | 100.0 | 2 | 11 | 0 | 2 | 3 | 4 | 259 | 0 | 0 | 1 | 51 |
| 2022 | 7 | PORT | 8 | 74.0 | 7 | 4 | 11 | 100.0 | 3 | 3 | 0 | 1 | 1 | 3 | 198 | 1 | 1 | 1 | 47 |
| Career highs | 41 | 86.0 | 17 | 8 | 21 | 100.0 | 5 | 11 | 0 | 4 | 3 | 6 | 368 | 1 | 1 | 2 | 83 | ||
Opponent Game highs
| Opponent | Games | ToG (%) | K | H | D | DE (%) | M | T | HO | FF | FA | CLR | MG | GAs | G | B | FA |
|---|---|---|---|---|---|---|---|---|---|---|---|---|---|---|---|---|---|
| Melbourne | 1 | 84.0 | 9 | 3 | 12 | 50.0 | 4 | 3 | 0 | 0 | 0 | 1 | 268 | 0 | 0 | 0 | 57 |
| Western Bulldogs | 3 | 72.0 | 9 | 3 | 11 | 75.0 | 2 | 3 | 0 | 1 | 2 | 2 | 177 | 0 | 0 | 0 | 44 |
| Fremantle | 2 | 85.0 | 12 | 3 | 15 | 50.0 | 3 | 4 | 0 | 0 | 1 | 0 | 316 | 0 | 0 | 0 | 59 |
| Brisbane Lions | 2 | 73.0 | 10 | 3 | 13 | 69.2 | 2 | 1 | 0 | 1 | 2 | 2 | 328 | 0 | 0 | 0 | 37 |
| GWS GIANTS | 3 | 79.0 | 9 | 4 | 13 | 61.5 | 2 | 3 | 0 | 1 | 1 | 4 | 312 | 0 | 0 | 0 | 51 |
| Carlton | 2 | 61.0 | 5 | 4 | 9 | 66.7 | 0 | 3 | 0 | 1 | 1 | 3 | 131 | 1 | 1 | 0 | 38 |
| Collingwood | 1 | 58.0 | 8 | 3 | 11 | 63.6 | 0 | 2 | 0 | 2 | 1 | 3 | 247 | 0 | 0 | 0 | 37 |
| Adelaide Crows | 2 | 77.0 | 16 | 2 | 18 | 61.5 | 3 | 6 | 0 | 4 | 2 | 6 | 330 | 0 | 0 | 0 | 83 |
| Kangaroos | 5 | 77.0 | 7 | 3 | 9 | 85.7 | 4 | 5 | 0 | 1 | 0 | 3 | 156 | 0 | 0 | 0 | 50 |
| Geelong Cats | 2 | 80.0 | 5 | 5 | 10 | 33.3 | 1 | 3 | 0 | 1 | 1 | 0 | 213 | 0 | 0 | 1 | 42 |
| Gold Coast SUNS | 4 | 76.0 | 17 | 4 | 21 | 100.0 | 5 | 11 | 0 | 1 | 3 | 3 | 368 | 0 | 1 | 0 | 80 |
| West Coast Eagles | 2 | 86.0 | 12 | 6 | 18 | 100.0 | 2 | 1 | 0 | 0 | 1 | 2 | 363 | 0 | 0 | 0 | 58 |
| Richmond | 2 | 77.0 | 9 | 2 | 10 | 83.3 | 2 | 7 | 0 | 2 | 1 | 2 | 157 | 0 | 0 | 0 | 64 |
| St Kilda | 3 | 82.0 | 9 | 2 | 11 | 100.0 | 2 | 4 | 0 | 1 | 3 | 1 | 175 | 0 | 0 | 0 | 32 |
| Essendon | 1 | 74.0 | 3 | 1 | 4 | 50.0 | 2 | 1 | 0 | 1 | 1 | 0 | 69 | 0 | 0 | 0 | 19 |
| Hawthorn | 4 | 74.0 | 12 | 8 | 15 | 80.0 | 3 | 4 | 0 | 2 | 2 | 2 | 281 | 0 | 0 | 2 | 56 |
| Sydney Swans | 2 | 61.0 | 7 | 4 | 11 | 72.7 | 3 | 3 | 0 | 2 | 1 | 3 | 198 | 1 | 0 | 0 | 47 |
Per Opponent Averages
| Opponent | Games | ToG (%) | K | H | D | DE (%) | M | T | HO | FF | FA | CLR | MG | GAs | G | B | FA |
|---|---|---|---|---|---|---|---|---|---|---|---|---|---|---|---|---|---|
| Melbourne | 1 | 84.0 | 9.0 | 3.0 | 12.0 | 50.0 | 4.0 | 3.0 | 0.0 | 0.0 | 0.0 | 1.0 | 268.0 | 0.0 | 0.0 | 0.0 | 57.0 |
| Western Bulldogs | 3 | 62.0 | 5.7 | 2.0 | 7.7 | 47.8 | 1.3 | 1.7 | 0.0 | 0.7 | 0.7 | 0.7 | 115.3 | 0.0 | 0.0 | 0.0 | 30.3 |
| Fremantle | 2 | 83.5 | 7.5 | 2.0 | 9.5 | 36.8 | 2.0 | 3.0 | 0.0 | 0.0 | 0.5 | 0.0 | 199.5 | 0.0 | 0.0 | 0.0 | 43.0 |
| Brisbane Lions | 2 | 65.5 | 6.0 | 2.0 | 8.0 | 68.7 | 1.0 | 0.5 | 0.0 | 0.5 | 2.0 | 1.0 | 207.5 | 0.0 | 0.0 | 0.0 | 21.5 |
| GWS GIANTS | 3 | 75.3 | 8.7 | 3.7 | 12.3 | 48.6 | 1.0 | 2.3 | 0.0 | 0.3 | 0.3 | 1.7 | 232.0 | 0.0 | 0.0 | 0.0 | 45.0 |
| Carlton | 2 | 55.0 | 3.0 | 2.5 | 5.5 | 54.6 | 0.0 | 2.5 | 0.0 | 0.5 | 0.5 | 1.5 | 82.5 | 0.5 | 0.5 | 0.0 | 26.0 |
| Collingwood | 1 | 58.0 | 8.0 | 3.0 | 11.0 | 63.6 | 0.0 | 2.0 | 0.0 | 2.0 | 1.0 | 3.0 | 247.0 | 0.0 | 0.0 | 0.0 | 37.0 |
| Adelaide Crows | 2 | 76.5 | 14.0 | 1.5 | 15.5 | 48.4 | 2.5 | 4.0 | 0.0 | 2.0 | 1.5 | 3.5 | 302.0 | 0.0 | 0.0 | 0.0 | 66.0 |
| Kangaroos | 5 | 70.6 | 5.0 | 1.6 | 6.6 | 54.5 | 1.4 | 2.2 | 0.0 | 0.4 | 0.0 | 0.8 | 105.8 | 0.0 | 0.0 | 0.0 | 31.6 |
| Geelong Cats | 2 | 77.5 | 4.5 | 3.5 | 8.0 | 31.2 | 1.0 | 3.0 | 0.0 | 0.5 | 0.5 | 0.0 | 189.0 | 0.0 | 0.0 | 0.5 | 35.0 |
| Gold Coast SUNS | 4 | 72.2 | 8.8 | 2.5 | 11.2 | 64.4 | 3.0 | 4.2 | 0.0 | 0.5 | 1.2 | 0.8 | 181.0 | 0.0 | 0.2 | 0.0 | 55.5 |
| West Coast Eagles | 2 | 74.0 | 7.0 | 4.5 | 11.5 | 56.5 | 1.5 | 0.5 | 0.0 | 0.0 | 0.5 | 1.0 | 198.0 | 0.0 | 0.0 | 0.0 | 35.0 |
| Richmond | 2 | 72.0 | 6.5 | 1.5 | 8.0 | 68.7 | 1.5 | 4.5 | 0.0 | 1.5 | 0.5 | 1.0 | 135.5 | 0.0 | 0.0 | 0.0 | 45.0 |
| St Kilda | 3 | 69.3 | 5.0 | 1.7 | 6.7 | 65.0 | 1.0 | 2.7 | 0.0 | 0.3 | 2.0 | 0.3 | 117.3 | 0.0 | 0.0 | 0.0 | 26.3 |
| Essendon | 1 | 74.0 | 3.0 | 1.0 | 4.0 | 50.0 | 2.0 | 1.0 | 0.0 | 1.0 | 1.0 | 0.0 | 69.0 | 0.0 | 0.0 | 0.0 | 19.0 |
| Hawthorn | 4 | 65.8 | 6.0 | 3.0 | 9.0 | 61.1 | 1.8 | 1.8 | 0.0 | 0.8 | 0.5 | 0.8 | 146.8 | 0.0 | 0.0 | 0.8 | 36.2 |
| Sydney Swans | 2 | 58.0 | 5.0 | 2.5 | 7.5 | 60.0 | 2.0 | 1.5 | 0.0 | 1.0 | 1.0 | 2.0 | 140.5 | 0.5 | 0.0 | 0.0 | 30.0 |
Per Venue Averages
| Venue | Games | ToG (%) | K | H | D | DE (%) | M | T | HO | FF | FA | CLR | MG | GAs | G | B | FA |
|---|---|---|---|---|---|---|---|---|---|---|---|---|---|---|---|---|---|
| Mission Whitten Oval | 1 | 76.0 | 6.0 | 3.0 | 9.0 | 44.4 | 0.0 | 5.0 | 0.0 | 1.0 | 0.0 | 3.0 | 146.0 | 0.0 | 0.0 | 0.0 | 45.0 |
| Alberton Oval | 22 | 69.3 | 6.5 | 2.6 | 9.1 | 57.2 | 1.6 | 2.6 | 0.0 | 0.8 | 0.9 | 1.2 | 167.2 | 0.1 | 0.0 | 0.0 | 38.8 |
| Bond University | 1 | 74.0 | 6.0 | 2.0 | 8.0 | 25.0 | 3.0 | 3.0 | 0.0 | 0.0 | 1.0 | 0.0 | 81.0 | 0.0 | 1.0 | 0.0 | 46.0 |
| Henson Park | 1 | 79.0 | 9.0 | 3.0 | 12.0 | 58.3 | 0.0 | 2.0 | 0.0 | 0.0 | 0.0 | 1.0 | 312.0 | 0.0 | 0.0 | 0.0 | 41.0 |
| Arden Street Oval | 2 | 73.5 | 4.5 | 0.5 | 5.0 | 70.0 | 2.0 | 2.5 | 0.0 | 0.5 | 0.0 | 0.0 | 85.0 | 0.0 | 0.0 | 0.0 | 31.0 |
| RSEA Park | 2 | 71.5 | 6.5 | 2.0 | 8.5 | 58.8 | 1.0 | 2.0 | 0.0 | 0.0 | 2.0 | 0.0 | 158.5 | 0.0 | 0.0 | 0.0 | 28.5 |
| Norwood Oval | 1 | 77.0 | 12.0 | 1.0 | 13.0 | 61.5 | 2.0 | 2.0 | 0.0 | 0.0 | 1.0 | 1.0 | 274.0 | 0.0 | 0.0 | 0.0 | 49.0 |
| Brighton Homes Arena | 1 | 73.0 | 10.0 | 3.0 | 13.0 | 69.2 | 2.0 | 0.0 | 0.0 | 1.0 | 2.0 | 2.0 | 328.0 | 0.0 | 0.0 | 0.0 | 37.0 |
| Kinetic Stadium | 2 | 63.5 | 3.0 | 4.5 | 7.5 | 60.0 | 1.0 | 1.0 | 0.0 | 1.0 | 0.0 | 0.5 | 78.0 | 0.0 | 0.0 | 0.5 | 26.5 |
| MCG | 1 | 72.0 | 9.0 | 2.0 | 11.0 | 27.3 | 2.0 | 3.0 | 0.0 | 1.0 | 2.0 | 2.0 | 177.0 | 0.0 | 0.0 | 0.0 | 44.0 |
| Mineral Resources Park | 2 | 74.0 | 7.0 | 4.5 | 11.5 | 56.5 | 1.5 | 0.5 | 0.0 | 0.0 | 0.5 | 1.0 | 198.0 | 0.0 | 0.0 | 0.0 | 35.0 |
| IKON Park | 4 | 65.5 | 5.5 | 0.8 | 6.2 | 36.0 | 1.5 | 3.5 | 0.0 | 0.5 | 0.5 | 0.8 | 124.2 | 0.0 | 0.0 | 0.5 | 36.0 |
| People First Stadium | 1 | 63.0 | 9.0 | 2.0 | 11.0 | 63.6 | 3.0 | 1.0 | 0.0 | 1.0 | 0.0 | 0.0 | 195.0 | 0.0 | 0.0 | 0.0 | 45.0 |
Venue Game highs
| Venue | Games | ToG (%) | K | H | D | DE (%) | M | T | HO | FF | FA | CLR | MG | GAs | G | B | FA |
|---|---|---|---|---|---|---|---|---|---|---|---|---|---|---|---|---|---|
| Mission Whitten Oval | 1 | 76.0 | 6 | 3 | 9 | 44.4 | 0 | 5 | 0 | 1 | 0 | 3 | 146 | 0 | 0 | 0 | 45 |
| Alberton Oval | 22 | 85.0 | 17 | 5 | 21 | 100.0 | 5 | 11 | 0 | 4 | 3 | 6 | 368 | 1 | 1 | 1 | 83 |
| Bond University | 1 | 74.0 | 6 | 2 | 8 | 25.0 | 3 | 3 | 0 | 0 | 1 | 0 | 81 | 0 | 1 | 0 | 46 |
| Henson Park | 1 | 79.0 | 9 | 3 | 12 | 58.3 | 0 | 2 | 0 | 0 | 0 | 1 | 312 | 0 | 0 | 0 | 41 |
| Arden Street Oval | 2 | 77.0 | 7 | 1 | 7 | 85.7 | 4 | 4 | 0 | 1 | 0 | 0 | 85 | 0 | 0 | 0 | 50 |
| RSEA Park | 2 | 82.0 | 9 | 2 | 11 | 66.7 | 2 | 3 | 0 | 0 | 3 | 0 | 175 | 0 | 0 | 0 | 32 |
| Norwood Oval | 1 | 77.0 | 12 | 1 | 13 | 61.5 | 2 | 2 | 0 | 0 | 1 | 1 | 274 | 0 | 0 | 0 | 49 |
| Brighton Homes Arena | 1 | 73.0 | 10 | 3 | 13 | 69.2 | 2 | 0 | 0 | 1 | 2 | 2 | 328 | 0 | 0 | 0 | 37 |
| Kinetic Stadium | 2 | 66.0 | 5 | 8 | 13 | 61.5 | 2 | 2 | 0 | 2 | 0 | 1 | 158 | 0 | 0 | 1 | 47 |
| MCG | 1 | 72.0 | 9 | 2 | 11 | 27.3 | 2 | 3 | 0 | 1 | 2 | 2 | 177 | 0 | 0 | 0 | 44 |
| Mineral Resources Park | 2 | 86.0 | 12 | 6 | 18 | 100.0 | 2 | 1 | 0 | 0 | 1 | 2 | 363 | 0 | 0 | 0 | 58 |
| IKON Park | 4 | 74.0 | 9 | 1 | 10 | 60.0 | 2 | 7 | 0 | 1 | 2 | 2 | 157 | 0 | 0 | 2 | 64 |
| People First Stadium | 1 | 63.0 | 9 | 2 | 11 | 63.6 | 3 | 1 | 0 | 1 | 0 | 0 | 195 | 0 | 0 | 0 | 45 |
Per Game Averages
| Year | Season | Club | Games | CP | UCP | i50 | M50 | R50 | T50 | TO | I | CM | 1% | CC | SC | C | B | SI | SG |
|---|---|---|---|---|---|---|---|---|---|---|---|---|---|---|---|---|---|---|---|
| 2025 | 10 | PORT | 12 | 6.5 | 5.6 | 1.3 | 0.0 | 3.2 | 0.0 | 4.8 | 7.8 | 0.0 | 1.9 | 0.0 | 0.8 | 3.2 | 0.1 | 1.2 | 0.0 |
| 2024 | 9 | PORT | 13 | 5.5 | 3.2 | 1.6 | 0.1 | 0.9 | 0.9 | 3.1 | 3.2 | 0.0 | 0.9 | 0.3 | 1.3 | 2.6 | 0.0 | 1.2 | 0.3 |
| 2023 | 8 | PORT | 8 | 4.9 | 3.0 | 1.9 | 0.0 | 0.4 | 0.9 | 2.5 | 2.1 | 0.0 | 0.8 | 0.2 | 0.9 | 2.4 | 0.1 | 1.5 | 0.1 |
| 2022 | 7 | PORT | 8 | 2.8 | 2.8 | 0.5 | 0.1 | 0.4 | 0.2 | 1.2 | 1.6 | 0.0 | 0.8 | 0.1 | 0.2 | 1.4 | 0.0 | 0.6 | 0.4 |
| Career averages | 41 | 5.1 | 3.8 | 1.4 | 0.0 | 1.4 | 0.5 | 3.1 | 4.0 | 0.0 | 1.1 | 0.2 | 0.9 | 2.5 | 0.0 | 1.1 | 0.2 | ||
Totals
| Year | Season | Club | Games | CP | UCP | i50 | M50 | R50 | T50 | TO | I | CM | 1% | CC | SC | C | B | SI | SG |
|---|---|---|---|---|---|---|---|---|---|---|---|---|---|---|---|---|---|---|---|
| 2025 | 10 | PORT | 12 | 78 | 67 | 16 | 0 | 38 | 0 | 57 | 94 | 0 | 23 | 0 | 9 | 38 | 1 | 14 | 0 |
| 2024 | 9 | PORT | 13 | 71 | 41 | 21 | 1 | 12 | 12 | 40 | 42 | 0 | 12 | 4 | 17 | 34 | 0 | 16 | 4 |
| 2023 | 8 | PORT | 8 | 39 | 24 | 15 | 0 | 3 | 7 | 20 | 17 | 0 | 6 | 2 | 7 | 19 | 1 | 12 | 1 |
| 2022 | 7 | PORT | 8 | 22 | 22 | 4 | 1 | 3 | 2 | 10 | 13 | 0 | 6 | 1 | 2 | 11 | 0 | 5 | 3 |
| Career totals | 41 | 210 | 154 | 56 | 2 | 56 | 21 | 127 | 166 | 0 | 47 | 7 | 35 | 102 | 2 | 47 | 8 | ||
Home/Away Per Game
| Club | Games | CP | UCP | i50 | M50 | R50 | T50 | TO | I | CM | 1% | CC | SC | C | B | SI | SG | |
|---|---|---|---|---|---|---|---|---|---|---|---|---|---|---|---|---|---|---|
| PORT | Home | 22 | 5.2 | 4.0 | 1.6 | 0.0 | 1.2 | 0.6 | 2.6 | 4.1 | 0.0 | 1.1 | 0.3 | 0.9 | 2.2 | 0.1 | 1.3 | 0.1 |
| PORT | Away | 19 | 5.0 | 3.4 | 1.1 | 0.1 | 1.6 | 0.4 | 3.6 | 3.9 | 0.0 | 1.2 | 0.0 | 0.8 | 2.8 | 0.0 | 1.0 | 0.3 |
Finals Per Game
| Year | Season | Club | Games | CP | UCP | i50 | M50 | R50 | T50 | TO | I | CM | 1% | CC | SC | C | B | SI | SG |
|---|---|---|---|---|---|---|---|---|---|---|---|---|---|---|---|---|---|---|---|
| 2024 | 9 | PORT | 13 | 5.5 | 3.2 | 1.6 | 0.1 | 0.9 | 0.9 | 3.1 | 3.2 | 0.0 | 0.9 | 0.3 | 1.3 | 2.6 | 0.0 | 1.2 | 0.3 |
| Career averages | 13 | 5.5 | 3.2 | 1.6 | 0.1 | 0.9 | 0.9 | 3.1 | 3.2 | 0.0 | 0.9 | 0.3 | 1.3 | 2.6 | 0.0 | 1.2 | 0.3 | ||
Game highs
| Year | Season | Club | Games | CP | UCP | i50 | M50 | R50 | T50 | TO | I | CM | 1% | CC | SC | C | B | SI | SG |
|---|---|---|---|---|---|---|---|---|---|---|---|---|---|---|---|---|---|---|---|
| 2025 | 10 | PORT | 12 | 11 | 15 | 5 | 0 | 7 | 0 | 8 | 13 | 0 | 4 | 0 | 2 | 7 | 1 | 4 | 0 |
| 2024 | 9 | PORT | 13 | 13 | 5 | 4 | 1 | 3 | 3 | 6 | 9 | 0 | 2 | 2 | 5 | 4 | 0 | 5 | 2 |
| 2023 | 8 | PORT | 8 | 11 | 6 | 6 | 0 | 1 | 3 | 7 | 6 | 0 | 3 | 2 | 3 | 4 | 1 | 3 | 1 |
| 2022 | 7 | PORT | 8 | 5 | 6 | 2 | 1 | 1 | 1 | 3 | 4 | 0 | 3 | 1 | 2 | 3 | 0 | 2 | 2 |
| Career highs | 41 | 13 | 15 | 6 | 1 | 7 | 3 | 8 | 13 | 0 | 4 | 2 | 5 | 7 | 1 | 5 | 2 | ||
Opponent Game highs
| Opponent | Games | CP | UCP | i50 | M50 | R50 | T50 | TO | I | CM | 1% | CC | SC | C | B | SI | SG |
|---|---|---|---|---|---|---|---|---|---|---|---|---|---|---|---|---|---|
| Melbourne | 1 | 6 | 6 | 0 | 0 | 6 | 0 | 2 | 6 | 0 | 2 | 0 | 1 | 2 | 0 | 0 | 0 |
| Western Bulldogs | 3 | 7 | 5 | 2 | 0 | 1 | 2 | 4 | 5 | 0 | 1 | 0 | 2 | 4 | 0 | 0 | 0 |
| Fremantle | 2 | 9 | 8 | 2 | 0 | 0 | 2 | 8 | 11 | 0 | 2 | 0 | 0 | 7 | 1 | 1 | 0 |
| Brisbane Lions | 2 | 11 | 3 | 2 | 0 | 5 | 0 | 7 | 12 | 0 | 2 | 0 | 2 | 4 | 0 | 1 | 0 |
| GWS GIANTS | 3 | 11 | 3 | 6 | 0 | 5 | 0 | 5 | 9 | 0 | 3 | 2 | 2 | 3 | 0 | 3 | 0 |
| Carlton | 2 | 5 | 3 | 2 | 0 | 0 | 0 | 1 | 1 | 0 | 2 | 1 | 2 | 3 | 0 | 5 | 1 |
| Collingwood | 1 | 8 | 3 | 4 | 0 | 0 | 0 | 2 | 3 | 0 | 0 | 2 | 1 | 2 | 0 | 2 | 0 |
| Adelaide Crows | 2 | 13 | 6 | 3 | 0 | 3 | 2 | 6 | 9 | 0 | 3 | 1 | 5 | 5 | 0 | 2 | 1 |
| Kangaroos | 5 | 8 | 4 | 0 | 0 | 3 | 0 | 5 | 4 | 0 | 3 | 0 | 3 | 4 | 0 | 1 | 0 |
| Geelong Cats | 2 | 6 | 6 | 2 | 0 | 1 | 3 | 5 | 4 | 0 | 2 | 0 | 0 | 4 | 1 | 3 | 1 |
| Gold Coast SUNS | 4 | 6 | 15 | 3 | 1 | 7 | 3 | 5 | 13 | 0 | 2 | 0 | 3 | 3 | 0 | 4 | 2 |
| West Coast Eagles | 2 | 11 | 5 | 2 | 0 | 2 | 0 | 7 | 10 | 0 | 4 | 0 | 2 | 6 | 0 | 3 | 0 |
| Richmond | 2 | 4 | 4 | 3 | 0 | 2 | 1 | 5 | 5 | 0 | 2 | 0 | 2 | 4 | 0 | 1 | 0 |
| St Kilda | 3 | 5 | 8 | 2 | 0 | 2 | 2 | 6 | 5 | 0 | 2 | 0 | 1 | 5 | 0 | 3 | 0 |
| Essendon | 1 | 2 | 4 | 1 | 0 | 0 | 0 | 2 | 4 | 0 | 1 | 0 | 0 | 2 | 0 | 0 | 0 |
| Hawthorn | 4 | 9 | 5 | 5 | 1 | 3 | 3 | 7 | 6 | 0 | 1 | 0 | 2 | 3 | 0 | 3 | 2 |
| Sydney Swans | 2 | 5 | 6 | 2 | 0 | 0 | 0 | 3 | 2 | 0 | 3 | 1 | 2 | 2 | 0 | 1 | 0 |
Per Opponent Averages
| Opponent | Games | CP | UCP | i50 | M50 | R50 | T50 | TO | I | CM | 1% | CC | SC | C | B | SI | SG |
|---|---|---|---|---|---|---|---|---|---|---|---|---|---|---|---|---|---|
| Melbourne | 1 | 6.0 | 6.0 | 0.0 | 0.0 | 6.0 | 0.0 | 2.0 | 6.0 | 0.0 | 2.0 | 0.0 | 1.0 | 2.0 | 0.0 | 0.0 | 0.0 |
| Western Bulldogs | 3 | 4.7 | 3.0 | 0.7 | 0.0 | 0.7 | 1.0 | 2.0 | 2.3 | 0.0 | 0.3 | 0.0 | 0.7 | 1.7 | 0.0 | 0.0 | 0.0 |
| Fremantle | 2 | 6.0 | 4.5 | 1.5 | 0.0 | 0.0 | 1.0 | 5.5 | 7.5 | 0.0 | 1.0 | 0.0 | 0.0 | 4.5 | 0.5 | 0.5 | 0.0 |
| Brisbane Lions | 2 | 6.0 | 3.0 | 1.5 | 0.0 | 2.5 | 0.0 | 4.5 | 6.5 | 0.0 | 1.0 | 0.0 | 1.0 | 3.0 | 0.0 | 1.0 | 0.0 |
| GWS GIANTS | 3 | 9.3 | 2.0 | 2.7 | 0.0 | 1.7 | 0.0 | 4.0 | 7.0 | 0.0 | 1.7 | 0.7 | 1.0 | 2.3 | 0.0 | 1.3 | 0.0 |
| Carlton | 2 | 3.5 | 1.5 | 1.5 | 0.0 | 0.0 | 0.0 | 1.0 | 1.0 | 0.0 | 1.0 | 0.5 | 1.0 | 2.0 | 0.0 | 2.5 | 0.5 |
| Collingwood | 1 | 8.0 | 3.0 | 4.0 | 0.0 | 0.0 | 0.0 | 2.0 | 3.0 | 0.0 | 0.0 | 2.0 | 1.0 | 2.0 | 0.0 | 2.0 | 0.0 |
| Adelaide Crows | 2 | 9.0 | 5.5 | 2.0 | 0.0 | 3.0 | 1.0 | 6.0 | 7.0 | 0.0 | 1.5 | 0.5 | 3.0 | 4.5 | 0.0 | 1.5 | 0.5 |
| Kangaroos | 5 | 4.2 | 2.8 | 0.0 | 0.0 | 1.4 | 0.0 | 2.4 | 2.4 | 0.0 | 1.8 | 0.0 | 0.8 | 2.4 | 0.0 | 0.4 | 0.0 |
| Geelong Cats | 2 | 5.0 | 4.0 | 1.5 | 0.0 | 1.0 | 1.5 | 3.5 | 3.5 | 0.0 | 1.5 | 0.0 | 0.0 | 3.5 | 0.5 | 1.5 | 0.5 |
| Gold Coast SUNS | 4 | 5.0 | 6.5 | 1.8 | 0.2 | 2.8 | 1.0 | 3.2 | 5.2 | 0.0 | 1.0 | 0.0 | 0.8 | 2.0 | 0.0 | 2.0 | 0.5 |
| West Coast Eagles | 2 | 7.0 | 3.5 | 1.0 | 0.0 | 1.5 | 0.0 | 3.5 | 6.0 | 0.0 | 2.0 | 0.0 | 1.0 | 3.5 | 0.0 | 2.0 | 0.0 |
| Richmond | 2 | 3.5 | 3.0 | 1.5 | 0.0 | 1.0 | 0.5 | 3.0 | 3.0 | 0.0 | 1.5 | 0.0 | 1.0 | 3.0 | 0.0 | 0.5 | 0.0 |
| St Kilda | 3 | 2.7 | 4.7 | 0.7 | 0.0 | 1.0 | 0.7 | 2.3 | 2.0 | 0.0 | 0.7 | 0.0 | 0.3 | 2.7 | 0.0 | 1.3 | 0.0 |
| Essendon | 1 | 2.0 | 4.0 | 1.0 | 0.0 | 0.0 | 0.0 | 2.0 | 4.0 | 0.0 | 1.0 | 0.0 | 0.0 | 2.0 | 0.0 | 0.0 | 0.0 |
| Hawthorn | 4 | 4.0 | 3.5 | 2.2 | 0.2 | 1.0 | 1.0 | 3.2 | 3.2 | 0.0 | 0.2 | 0.0 | 0.8 | 1.2 | 0.0 | 1.8 | 0.8 |
| Sydney Swans | 2 | 3.5 | 4.0 | 1.0 | 0.0 | 0.0 | 0.0 | 2.0 | 2.0 | 0.0 | 1.5 | 0.5 | 1.5 | 1.5 | 0.0 | 0.5 | 0.0 |
Per Venue Averages
| Opponent | Games | CP | UCP | i50 | M50 | R50 | T50 | TO | I | CM | 1% | CC | SC | C | B | SI | SG |
|---|---|---|---|---|---|---|---|---|---|---|---|---|---|---|---|---|---|
| Mission Whitten Oval | 1 | 8.0 | 2.0 | 0.0 | 0.0 | 1.0 | 0.0 | 2.0 | 2.0 | 0.0 | 2.0 | 0.0 | 3.0 | 4.0 | 0.0 | 0.0 | 0.0 |
| Alberton Oval | 22 | 5.2 | 4.0 | 1.6 | 0.0 | 1.2 | 0.6 | 2.6 | 4.1 | 0.0 | 1.1 | 0.3 | 0.9 | 2.2 | 0.1 | 1.3 | 0.1 |
| Bond University | 1 | 3.0 | 5.0 | 0.0 | 1.0 | 1.0 | 1.0 | 3.0 | 0.0 | 0.0 | 0.0 | 0.0 | 0.0 | 2.0 | 0.0 | 1.0 | 2.0 |
| Henson Park | 1 | 9.0 | 0.0 | 1.0 | 0.0 | 5.0 | 0.0 | 5.0 | 9.0 | 0.0 | 2.0 | 0.0 | 1.0 | 2.0 | 0.0 | 0.0 | 0.0 |
| Arden Street Oval | 2 | 3.0 | 2.5 | 0.0 | 0.0 | 1.5 | 0.0 | 2.0 | 2.5 | 0.0 | 2.5 | 0.0 | 0.0 | 1.5 | 0.0 | 1.0 | 0.0 |
| RSEA Park | 2 | 3.5 | 6.0 | 1.0 | 0.0 | 1.5 | 0.0 | 3.5 | 3.0 | 0.0 | 0.0 | 0.0 | 0.0 | 3.0 | 0.0 | 1.5 | 0.0 |
| Norwood Oval | 1 | 5.0 | 6.0 | 1.0 | 0.0 | 3.0 | 0.0 | 6.0 | 9.0 | 0.0 | 3.0 | 0.0 | 1.0 | 5.0 | 0.0 | 1.0 | 0.0 |
| Brighton Homes Arena | 1 | 11.0 | 3.0 | 1.0 | 0.0 | 5.0 | 0.0 | 7.0 | 12.0 | 0.0 | 2.0 | 0.0 | 2.0 | 4.0 | 0.0 | 1.0 | 0.0 |
| Kinetic Stadium | 2 | 4.5 | 2.5 | 1.5 | 0.0 | 0.0 | 0.5 | 3.5 | 3.0 | 0.0 | 0.0 | 0.0 | 0.5 | 1.0 | 0.0 | 1.0 | 0.5 |
| MCG | 1 | 7.0 | 3.0 | 2.0 | 0.0 | 1.0 | 2.0 | 4.0 | 1.0 | 0.0 | 0.0 | 0.0 | 2.0 | 4.0 | 0.0 | 0.0 | 0.0 |
| Mineral Resources Park | 2 | 7.0 | 3.5 | 1.0 | 0.0 | 1.5 | 0.0 | 3.5 | 6.0 | 0.0 | 2.0 | 0.0 | 1.0 | 3.5 | 0.0 | 2.0 | 0.0 |
| IKON Park | 4 | 2.5 | 3.0 | 1.2 | 0.2 | 0.8 | 1.0 | 3.2 | 1.2 | 0.0 | 0.5 | 0.0 | 0.8 | 3.2 | 0.0 | 0.8 | 0.5 |
| People First Stadium | 1 | 6.0 | 5.0 | 3.0 | 0.0 | 2.0 | 0.0 | 4.0 | 8.0 | 0.0 | 2.0 | 0.0 | 0.0 | 1.0 | 0.0 | 2.0 | 0.0 |
Venue Game highs
| Opponent | Games | CP | UCP | i50 | M50 | R50 | T50 | TO | I | CM | 1% | CC | SC | C | B | SI | SG |
|---|---|---|---|---|---|---|---|---|---|---|---|---|---|---|---|---|---|
| Mission Whitten Oval | 1 | 8 | 2 | 0 | 0 | 1 | 0 | 2 | 2 | 0 | 2 | 0 | 3 | 4 | 0 | 0 | 0 |
| Alberton Oval | 22 | 13 | 15 | 6 | 0 | 7 | 3 | 8 | 13 | 0 | 3 | 2 | 5 | 7 | 1 | 5 | 1 |
| Bond University | 1 | 3 | 5 | 0 | 1 | 1 | 1 | 3 | 0 | 0 | 0 | 0 | 0 | 2 | 0 | 1 | 2 |
| Henson Park | 1 | 9 | 0 | 1 | 0 | 5 | 0 | 5 | 9 | 0 | 2 | 0 | 1 | 2 | 0 | 0 | 0 |
| Arden Street Oval | 2 | 3 | 4 | 0 | 0 | 3 | 0 | 3 | 4 | 0 | 3 | 0 | 0 | 2 | 0 | 1 | 0 |
| RSEA Park | 2 | 5 | 8 | 2 | 0 | 2 | 0 | 6 | 5 | 0 | 0 | 0 | 0 | 5 | 0 | 3 | 0 |
| Norwood Oval | 1 | 5 | 6 | 1 | 0 | 3 | 0 | 6 | 9 | 0 | 3 | 0 | 1 | 5 | 0 | 1 | 0 |
| Brighton Homes Arena | 1 | 11 | 3 | 1 | 0 | 5 | 0 | 7 | 12 | 0 | 2 | 0 | 2 | 4 | 0 | 1 | 0 |
| Kinetic Stadium | 2 | 9 | 4 | 3 | 0 | 0 | 1 | 7 | 6 | 0 | 0 | 0 | 1 | 2 | 0 | 2 | 1 |
| MCG | 1 | 7 | 3 | 2 | 0 | 1 | 2 | 4 | 1 | 0 | 0 | 0 | 2 | 4 | 0 | 0 | 0 |
| Mineral Resources Park | 2 | 11 | 5 | 2 | 0 | 2 | 0 | 7 | 10 | 0 | 4 | 0 | 2 | 6 | 0 | 3 | 0 |
| IKON Park | 4 | 3 | 4 | 3 | 1 | 2 | 3 | 5 | 2 | 0 | 1 | 0 | 2 | 4 | 0 | 2 | 2 |
| People First Stadium | 1 | 6 | 5 | 3 | 0 | 2 | 0 | 4 | 8 | 0 | 2 | 0 | 0 | 1 | 0 | 2 | 0 |