32
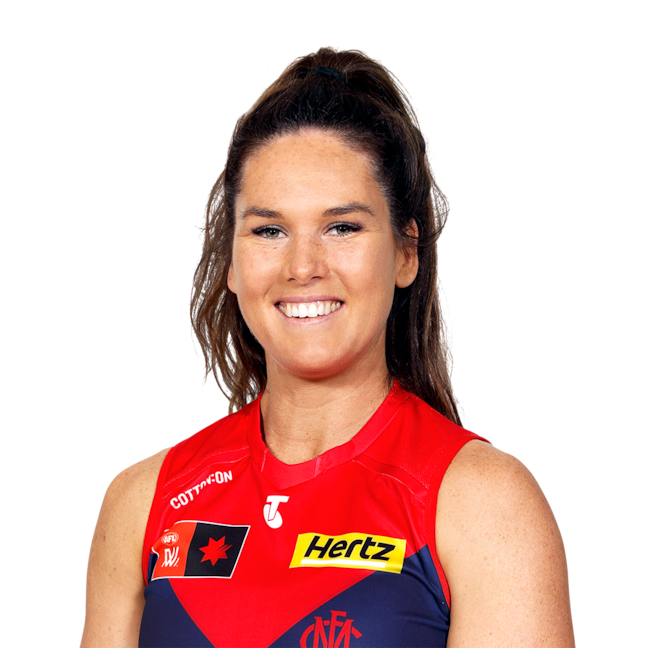
Gabrielle
Colvin
Per Game Averages
| Year | Season | Club | Games | ToG (%) | K | H | D | DE (%) | M | T | HO | FF | FA | CLR | MG | GAs | G | B | FA |
|---|---|---|---|---|---|---|---|---|---|---|---|---|---|---|---|---|---|---|---|
| 2025 | 10 | MELB | 6 | 82.8 | 5.0 | 2.0 | 7.0 | 47.6 | 1.2 | 3.2 | 0.0 | 0.8 | 0.8 | 0.0 | 122.0 | 0.0 | 0.0 | 0.0 | 33.5 |
| 2024 | 9 | MELB | 7 | 77.3 | 4.3 | 2.7 | 7.0 | 65.3 | 1.9 | 2.9 | 0.0 | 0.7 | 0.9 | 0.0 | 92.0 | 0.0 | 0.0 | 0.0 | 33.4 |
| 2023 | 8 | MELB | 2 | 69.0 | 1.5 | 3.5 | 5.0 | 80.0 | 0.5 | 3.0 | 0.0 | 0.5 | 0.0 | 0.0 | 44.0 | 0.0 | 0.0 | 0.0 | 25.5 |
| 2022 | 6 | MELB | 9 | 83.3 | 5.0 | 2.4 | 7.4 | 64.2 | 1.8 | 2.2 | 0.0 | 1.1 | 0.6 | 0.1 | 107.8 | 0.0 | 0.0 | 0.0 | 33.6 |
| 2021 | 5 | MELB | 11 | 71.0 | 2.5 | 2.0 | 4.5 | 62.0 | 1.0 | 2.5 | 0.0 | 0.4 | 0.7 | 0.0 | 49.3 | 0.0 | 0.0 | 0.0 | 22.6 |
| 2020 | 4 | MELB | 5 | 61.4 | 3.6 | 2.2 | 5.8 | 62.1 | 1.0 | 1.4 | 0.0 | 0.4 | 0.8 | 0.2 | 75.2 | 0.0 | 0.0 | 0.0 | 21.8 |
| Career averages | 40 | 75.4 | 3.8 | 2.3 | 6.2 | 61.5 | 1.3 | 2.5 | 0.0 | 0.7 | 0.7 | 0.1 | 83.8 | 0.0 | 0.0 | 0.0 | 28.6 | ||
Totals
| Year | Season | Club | Games | K | H | D | M | T | HO | FF | FA | CLR | MG | GAs | G | B | FA |
|---|---|---|---|---|---|---|---|---|---|---|---|---|---|---|---|---|---|
| 2025 | 10 | MELB | 6 | 30 | 12 | 42 | 7 | 19 | 0 | 5 | 5 | 0 | 732 | 0 | 0 | 0 | 201 |
| 2024 | 9 | MELB | 7 | 30 | 19 | 49 | 13 | 20 | 0 | 5 | 6 | 0 | 644 | 0 | 0 | 0 | 234 |
| 2023 | 8 | MELB | 2 | 3 | 7 | 10 | 1 | 6 | 0 | 1 | 0 | 0 | 88 | 0 | 0 | 0 | 51 |
| 2022 | 6 | MELB | 9 | 45 | 22 | 67 | 16 | 20 | 0 | 10 | 5 | 1 | 970 | 0 | 0 | 0 | 302 |
| 2021 | 5 | MELB | 11 | 28 | 22 | 50 | 11 | 27 | 0 | 4 | 8 | 0 | 542 | 0 | 0 | 0 | 249 |
| 2020 | 4 | MELB | 5 | 18 | 11 | 29 | 5 | 7 | 0 | 2 | 4 | 1 | 376 | 0 | 0 | 0 | 109 |
| Career totals | 40 | 154 | 93 | 247 | 53 | 99 | 0 | 27 | 28 | 2 | 3352 | 0 | 0 | 0 | 1146 | ||
Home/Away Per Game
| Club | Games | ToG (%) | K | H | D | DE (%) | M | T | HO | FF | FA | CLR | MG | GAs | G | B | FA | |
|---|---|---|---|---|---|---|---|---|---|---|---|---|---|---|---|---|---|---|
| MELB | Home | 20 | 76.6 | 3.4 | 2.0 | 5.4 | 58.9 | 1.0 | 2.6 | 0.0 | 0.6 | 0.4 | 0.1 | 77.8 | 0.0 | 0.0 | 0.0 | 26.5 |
| MELB | Away | 20 | 74.2 | 4.4 | 2.6 | 7.0 | 63.6 | 1.7 | 2.4 | 0.0 | 0.8 | 1.0 | 0.1 | 89.8 | 0.0 | 0.0 | 0.0 | 30.8 |
Finals Per Game
| Year | Season | Club | Games | ToG (%) | K | H | D | DE (%) | M | T | HO | FF | FA | CLR | MG | GAs | G | B | FA |
|---|---|---|---|---|---|---|---|---|---|---|---|---|---|---|---|---|---|---|---|
| 2024 | 9 | MELB | 7 | 77.3 | 4.3 | 2.7 | 7.0 | 65.3 | 1.9 | 2.9 | 0.0 | 0.7 | 0.9 | 0.0 | 92.0 | 0.0 | 0.0 | 0.0 | 33.4 |
| 2022 | 6 | MELB | 2 | 84.0 | 5.5 | 5.0 | 10.5 | 71.4 | 1.5 | 3.0 | 0.0 | 0.5 | 0.5 | 0.0 | 121.0 | 0.0 | 0.0 | 0.0 | 42.0 |
| 2021 | 5 | MELB | 2 | 70.0 | 4.5 | 2.5 | 7.0 | 71.4 | 2.0 | 3.0 | 0.0 | 0.0 | 1.0 | 0.0 | 74.5 | 0.0 | 0.0 | 0.0 | 33.5 |
| 2020 | 4 | MELB | 1 | 69.0 | 5.0 | 1.0 | 6.0 | 50.0 | 1.0 | 2.0 | 0.0 | 0.0 | 1.0 | 1.0 | 123.0 | 0.0 | 0.0 | 0.0 | 25.0 |
| Career averages | 12 | 76.5 | 4.6 | 2.9 | 7.5 | 66.7 | 1.8 | 2.8 | 0.0 | 0.5 | 0.8 | 0.1 | 96.5 | 0.0 | 0.0 | 0.0 | 34.2 | ||
Game highs
| Year | Season | Club | Games | ToG (%) | K | H | D | DE (%) | M | T | HO | FF | FA | CLR | MG | GAs | G | B | FA |
|---|---|---|---|---|---|---|---|---|---|---|---|---|---|---|---|---|---|---|---|
| 2025 | 10 | MELB | 6 | 95.0 | 10 | 5 | 12 | 70.0 | 3 | 6 | 0 | 2 | 2 | 0 | 210 | 0 | 0 | 0 | 58 |
| 2024 | 9 | MELB | 7 | 92.0 | 9 | 7 | 10 | 88.9 | 7 | 5 | 0 | 2 | 2 | 0 | 144 | 0 | 0 | 0 | 71 |
| 2023 | 8 | MELB | 2 | 75.0 | 3 | 4 | 7 | 100.0 | 1 | 5 | 0 | 1 | 0 | 0 | 84 | 0 | 0 | 0 | 26 |
| 2022 | 6 | MELB | 9 | 94.0 | 8 | 5 | 12 | 83.3 | 4 | 5 | 0 | 3 | 3 | 1 | 187 | 0 | 0 | 0 | 57 |
| 2021 | 5 | MELB | 11 | 97.0 | 5 | 4 | 8 | 100.0 | 3 | 5 | 0 | 1 | 2 | 0 | 103 | 0 | 0 | 0 | 42 |
| 2020 | 4 | MELB | 5 | 81.0 | 5 | 3 | 8 | 83.3 | 3 | 4 | 0 | 2 | 2 | 1 | 123 | 0 | 0 | 0 | 34 |
| Career highs | 40 | 97.0 | 10 | 7 | 12 | 100.0 | 7 | 6 | 0 | 3 | 3 | 1 | 210 | 0 | 0 | 0 | 71 | ||
Opponent Game highs
| Opponent | Games | ToG (%) | K | H | D | DE (%) | M | T | HO | FF | FA | CLR | MG | GAs | G | B | FA |
|---|---|---|---|---|---|---|---|---|---|---|---|---|---|---|---|---|---|
| Western Bulldogs | 2 | 97.0 | 4 | 4 | 6 | 83.3 | 0 | 5 | 0 | 2 | 0 | 0 | 96 | 0 | 0 | 0 | 32 |
| Fremantle | 5 | 83.0 | 5 | 3 | 7 | 50.0 | 1 | 6 | 0 | 1 | 2 | 0 | 120 | 0 | 0 | 0 | 42 |
| Brisbane Lions | 3 | 77.0 | 5 | 5 | 9 | 100.0 | 1 | 4 | 0 | 1 | 1 | 0 | 116 | 0 | 0 | 0 | 37 |
| GWS GIANTS | 3 | 70.0 | 5 | 1 | 6 | 50.0 | 1 | 2 | 0 | 1 | 1 | 1 | 123 | 0 | 0 | 0 | 25 |
| Carlton | 1 | 86.0 | 8 | 1 | 9 | 77.8 | 4 | 2 | 0 | 3 | 0 | 0 | 187 | 0 | 0 | 0 | 49 |
| Collingwood | 2 | 71.0 | 4 | 4 | 8 | 66.7 | 3 | 3 | 0 | 1 | 2 | 0 | 86 | 0 | 0 | 0 | 42 |
| Adelaide Crows | 6 | 94.0 | 8 | 5 | 12 | 100.0 | 3 | 5 | 0 | 2 | 2 | 0 | 155 | 0 | 0 | 0 | 57 |
| Kangaroos | 3 | 91.0 | 5 | 7 | 9 | 88.9 | 1 | 4 | 0 | 1 | 1 | 0 | 91 | 0 | 0 | 0 | 36 |
| Geelong Cats | 2 | 75.0 | 3 | 4 | 7 | 71.4 | 1 | 1 | 0 | 1 | 1 | 0 | 84 | 0 | 0 | 0 | 25 |
| Gold Coast SUNS | 3 | 95.0 | 5 | 3 | 6 | 75.0 | 1 | 2 | 0 | 1 | 2 | 0 | 114 | 0 | 0 | 0 | 26 |
| West Coast Eagles | 1 | 71.0 | 4 | 2 | 6 | 16.7 | 2 | 3 | 0 | 0 | 1 | 0 | 129 | 0 | 0 | 0 | 31 |
| Richmond | 3 | 81.0 | 5 | 5 | 10 | 100.0 | 1 | 3 | 0 | 2 | 3 | 0 | 108 | 0 | 0 | 0 | 39 |
| St Kilda | 3 | 81.0 | 5 | 3 | 8 | 100.0 | 4 | 2 | 0 | 1 | 2 | 1 | 93 | 0 | 0 | 0 | 33 |
| Essendon | 2 | 92.0 | 9 | 2 | 10 | 70.0 | 7 | 5 | 0 | 1 | 0 | 0 | 144 | 0 | 0 | 0 | 71 |
| Port Adelaide | 1 | 83.0 | 10 | 2 | 12 | 50.0 | 3 | 4 | 0 | 2 | 1 | 0 | 210 | 0 | 0 | 0 | 58 |
Per Opponent Averages
| Opponent | Games | ToG (%) | K | H | D | DE (%) | M | T | HO | FF | FA | CLR | MG | GAs | G | B | FA |
|---|---|---|---|---|---|---|---|---|---|---|---|---|---|---|---|---|---|
| Western Bulldogs | 2 | 71.5 | 2.5 | 3.0 | 5.5 | 72.7 | 0.0 | 3.0 | 0.0 | 1.5 | 0.0 | 0.0 | 61.5 | 0.0 | 0.0 | 0.0 | 27.0 |
| Fremantle | 5 | 71.2 | 3.8 | 2.2 | 6.0 | 46.7 | 0.8 | 2.8 | 0.0 | 0.6 | 0.8 | 0.0 | 75.6 | 0.0 | 0.0 | 0.0 | 27.6 |
| Brisbane Lions | 3 | 71.7 | 3.3 | 2.0 | 5.3 | 62.5 | 0.7 | 2.0 | 0.0 | 0.3 | 0.3 | 0.0 | 82.0 | 0.0 | 0.0 | 0.0 | 23.3 |
| GWS GIANTS | 3 | 67.0 | 3.7 | 1.0 | 4.7 | 50.0 | 1.0 | 1.3 | 0.0 | 0.3 | 0.3 | 0.3 | 81.7 | 0.0 | 0.0 | 0.0 | 20.7 |
| Carlton | 1 | 86.0 | 8.0 | 1.0 | 9.0 | 77.8 | 4.0 | 2.0 | 0.0 | 3.0 | 0.0 | 0.0 | 187.0 | 0.0 | 0.0 | 0.0 | 49.0 |
| Collingwood | 2 | 53.5 | 2.5 | 3.0 | 5.5 | 63.6 | 1.5 | 1.5 | 0.0 | 0.5 | 1.0 | 0.0 | 49.5 | 0.0 | 0.0 | 0.0 | 21.5 |
| Adelaide Crows | 6 | 76.0 | 4.8 | 2.8 | 7.7 | 71.7 | 1.7 | 4.0 | 0.0 | 0.8 | 0.8 | 0.0 | 93.8 | 0.0 | 0.0 | 0.0 | 39.5 |
| Kangaroos | 3 | 85.3 | 3.3 | 4.0 | 7.3 | 54.6 | 1.0 | 3.7 | 0.0 | 0.3 | 0.7 | 0.0 | 75.7 | 0.0 | 0.0 | 0.0 | 34.0 |
| Geelong Cats | 2 | 73.0 | 2.5 | 2.5 | 5.0 | 70.0 | 1.0 | 0.5 | 0.0 | 0.5 | 0.5 | 0.0 | 74.5 | 0.0 | 0.0 | 0.0 | 16.5 |
| Gold Coast SUNS | 3 | 84.3 | 2.7 | 1.3 | 4.0 | 58.3 | 0.3 | 1.0 | 0.0 | 0.3 | 1.3 | 0.0 | 73.3 | 0.0 | 0.0 | 0.0 | 12.0 |
| West Coast Eagles | 1 | 71.0 | 4.0 | 2.0 | 6.0 | 16.7 | 2.0 | 3.0 | 0.0 | 0.0 | 1.0 | 0.0 | 129.0 | 0.0 | 0.0 | 0.0 | 31.0 |
| Richmond | 3 | 75.3 | 2.3 | 3.3 | 5.7 | 70.6 | 0.3 | 2.3 | 0.0 | 1.0 | 1.0 | 0.0 | 46.0 | 0.0 | 0.0 | 0.0 | 22.0 |
| St Kilda | 3 | 78.7 | 3.3 | 1.7 | 5.0 | 80.0 | 2.3 | 1.0 | 0.0 | 0.3 | 1.0 | 0.3 | 70.3 | 0.0 | 0.0 | 0.0 | 21.7 |
| Essendon | 2 | 89.5 | 6.5 | 1.5 | 8.0 | 56.2 | 4.0 | 4.0 | 0.0 | 0.5 | 0.0 | 0.0 | 113.5 | 0.0 | 0.0 | 0.0 | 51.0 |
| Port Adelaide | 1 | 83.0 | 10.0 | 2.0 | 12.0 | 50.0 | 3.0 | 4.0 | 0.0 | 2.0 | 1.0 | 0.0 | 210.0 | 0.0 | 0.0 | 0.0 | 58.0 |
Per Venue Averages
| Venue | Games | ToG (%) | K | H | D | DE (%) | M | T | HO | FF | FA | CLR | MG | GAs | G | B | FA |
|---|---|---|---|---|---|---|---|---|---|---|---|---|---|---|---|---|---|
| Mission Whitten Oval | 2 | 71.5 | 2.5 | 3.0 | 5.5 | 72.7 | 0.0 | 3.0 | 0.0 | 1.5 | 0.0 | 0.0 | 61.5 | 0.0 | 0.0 | 0.0 | 27.0 |
| Alberton Oval | 1 | 83.0 | 10.0 | 2.0 | 12.0 | 50.0 | 3.0 | 4.0 | 0.0 | 2.0 | 1.0 | 0.0 | 210.0 | 0.0 | 0.0 | 0.0 | 58.0 |
| Swinburne Centre | 1 | 81.0 | 2.0 | 3.0 | 5.0 | 60.0 | 1.0 | 2.0 | 0.0 | 1.0 | 3.0 | 0.0 | 24.0 | 0.0 | 0.0 | 0.0 | 15.0 |
| Marvel Stadium | 1 | 36.0 | 1.0 | 2.0 | 3.0 | 66.7 | 0.0 | 0.0 | 0.0 | 0.0 | 2.0 | 0.0 | 13.0 | 0.0 | 0.0 | 0.0 | 1.0 |
| Fremantle Oval | 3 | 67.3 | 3.7 | 2.0 | 5.7 | 47.1 | 1.0 | 2.7 | 0.0 | 0.7 | 1.0 | 0.0 | 72.3 | 0.0 | 0.0 | 0.0 | 26.3 |
| Optus Stadium | 1 | 83.0 | 4.0 | 3.0 | 7.0 | 42.9 | 0.0 | 1.0 | 0.0 | 1.0 | 1.0 | 0.0 | 115.0 | 0.0 | 0.0 | 0.0 | 20.0 |
| GMHBA Stadium | 2 | 73.0 | 2.5 | 2.5 | 5.0 | 70.0 | 1.0 | 0.5 | 0.0 | 0.5 | 0.5 | 0.0 | 74.5 | 0.0 | 0.0 | 0.0 | 16.5 |
| Windy Hill | 1 | 92.0 | 9.0 | 1.0 | 10.0 | 70.0 | 7.0 | 5.0 | 0.0 | 1.0 | 0.0 | 0.0 | 144.0 | 0.0 | 0.0 | 0.0 | 71.0 |
| RSEA Park | 1 | 81.0 | 5.0 | 3.0 | 8.0 | 75.0 | 3.0 | 0.0 | 0.0 | 0.0 | 1.0 | 0.0 | 93.0 | 0.0 | 0.0 | 0.0 | 27.0 |
| Casey Fields | 17 | 76.9 | 3.3 | 1.9 | 5.2 | 60.2 | 1.0 | 2.7 | 0.0 | 0.6 | 0.5 | 0.1 | 75.0 | 0.0 | 0.0 | 0.0 | 26.7 |
| Norwood Oval | 2 | 83.5 | 6.5 | 3.0 | 9.5 | 63.2 | 2.0 | 4.5 | 0.0 | 1.5 | 1.0 | 0.0 | 123.5 | 0.0 | 0.0 | 0.0 | 48.0 |
| MCG | 1 | 75.0 | 4.0 | 5.0 | 9.0 | 66.7 | 0.0 | 2.0 | 0.0 | 0.0 | 1.0 | 0.0 | 116.0 | 0.0 | 0.0 | 0.0 | 27.0 |
| ENGIE Stadium | 1 | 69.0 | 5.0 | 1.0 | 6.0 | 50.0 | 1.0 | 2.0 | 0.0 | 0.0 | 1.0 | 1.0 | 123.0 | 0.0 | 0.0 | 0.0 | 25.0 |
| IKON Park | 2 | 74.5 | 3.5 | 1.5 | 5.0 | 40.0 | 1.0 | 2.0 | 0.0 | 0.0 | 0.0 | 0.0 | 82.0 | 0.0 | 0.0 | 0.0 | 24.5 |
| Adelaide Oval | 2 | 81.0 | 6.0 | 4.0 | 10.0 | 80.0 | 3.0 | 2.5 | 0.0 | 0.5 | 1.0 | 0.0 | 114.5 | 0.0 | 0.0 | 0.0 | 42.5 |
| Victoria Park | 1 | 71.0 | 4.0 | 4.0 | 8.0 | 62.5 | 3.0 | 3.0 | 0.0 | 1.0 | 0.0 | 0.0 | 86.0 | 0.0 | 0.0 | 0.0 | 42.0 |
| People First Stadium | 1 | 67.0 | 1.0 | 3.0 | 4.0 | 75.0 | 1.0 | 1.0 | 0.0 | 0.0 | 2.0 | 0.0 | 24.0 | 0.0 | 0.0 | 0.0 | 10.0 |
Venue Game highs
| Venue | Games | ToG (%) | K | H | D | DE (%) | M | T | HO | FF | FA | CLR | MG | GAs | G | B | FA |
|---|---|---|---|---|---|---|---|---|---|---|---|---|---|---|---|---|---|
| Mission Whitten Oval | 2 | 97.0 | 4 | 4 | 6 | 83.3 | 0 | 5 | 0 | 2 | 0 | 0 | 96 | 0 | 0 | 0 | 32 |
| Alberton Oval | 1 | 83.0 | 10 | 2 | 12 | 50.0 | 3 | 4 | 0 | 2 | 1 | 0 | 210 | 0 | 0 | 0 | 58 |
| Swinburne Centre | 1 | 81.0 | 2 | 3 | 5 | 60.0 | 1 | 2 | 0 | 1 | 3 | 0 | 24 | 0 | 0 | 0 | 15 |
| Marvel Stadium | 1 | 36.0 | 1 | 2 | 3 | 66.7 | 0 | 0 | 0 | 0 | 2 | 0 | 13 | 0 | 0 | 0 | 1 |
| Fremantle Oval | 3 | 82.0 | 5 | 3 | 7 | 50.0 | 1 | 6 | 0 | 1 | 2 | 0 | 120 | 0 | 0 | 0 | 42 |
| Optus Stadium | 1 | 83.0 | 4 | 3 | 7 | 42.9 | 0 | 1 | 0 | 1 | 1 | 0 | 115 | 0 | 0 | 0 | 20 |
| GMHBA Stadium | 2 | 75.0 | 3 | 4 | 7 | 71.4 | 1 | 1 | 0 | 1 | 1 | 0 | 84 | 0 | 0 | 0 | 25 |
| Windy Hill | 1 | 92.0 | 9 | 1 | 10 | 70.0 | 7 | 5 | 0 | 1 | 0 | 0 | 144 | 0 | 0 | 0 | 71 |
| RSEA Park | 1 | 81.0 | 5 | 3 | 8 | 75.0 | 3 | 0 | 0 | 0 | 1 | 0 | 93 | 0 | 0 | 0 | 27 |
| Casey Fields | 17 | 95.0 | 8 | 7 | 10 | 100.0 | 4 | 5 | 0 | 3 | 2 | 1 | 187 | 0 | 0 | 0 | 49 |
| Norwood Oval | 2 | 94.0 | 8 | 5 | 10 | 70.0 | 3 | 5 | 0 | 2 | 2 | 0 | 155 | 0 | 0 | 0 | 56 |
| MCG | 1 | 75.0 | 4 | 5 | 9 | 66.7 | 0 | 2 | 0 | 0 | 1 | 0 | 116 | 0 | 0 | 0 | 27 |
| ENGIE Stadium | 1 | 69.0 | 5 | 1 | 6 | 50.0 | 1 | 2 | 0 | 0 | 1 | 1 | 123 | 0 | 0 | 0 | 25 |
| IKON Park | 2 | 87.0 | 4 | 2 | 6 | 50.0 | 1 | 3 | 0 | 0 | 0 | 0 | 83 | 0 | 0 | 0 | 31 |
| Adelaide Oval | 2 | 93.0 | 7 | 5 | 12 | 87.5 | 3 | 4 | 0 | 1 | 2 | 0 | 126 | 0 | 0 | 0 | 57 |
| Victoria Park | 1 | 71.0 | 4 | 4 | 8 | 62.5 | 3 | 3 | 0 | 1 | 0 | 0 | 86 | 0 | 0 | 0 | 42 |
| People First Stadium | 1 | 67.0 | 1 | 3 | 4 | 75.0 | 1 | 1 | 0 | 0 | 2 | 0 | 24 | 0 | 0 | 0 | 10 |
Per Game Averages
| Year | Season | Club | Games | CP | UCP | i50 | M50 | R50 | T50 | TO | I | CM | 1% | CC | SC | C | B | SI | SG |
|---|---|---|---|---|---|---|---|---|---|---|---|---|---|---|---|---|---|---|---|
| 2025 | 10 | MELB | 6 | 3.5 | 3.0 | 0.5 | 0.0 | 2.0 | 0.0 | 2.8 | 4.7 | 0.2 | 4.5 | 0.0 | 0.0 | 2.2 | 0.0 | 0.5 | 0.0 |
| 2024 | 9 | MELB | 7 | 3.9 | 3.3 | 0.7 | 0.0 | 2.1 | 0.3 | 1.9 | 4.7 | 0.3 | 4.7 | 0.0 | 0.0 | 1.7 | 0.0 | 0.1 | 0.0 |
| 2023 | 8 | MELB | 2 | 2.5 | 2.0 | 0.0 | 0.0 | 1.5 | 0.0 | 1.0 | 3.5 | 0.0 | 2.0 | 0.0 | 0.0 | 0.5 | 0.0 | 0.5 | 0.0 |
| 2022 | 6 | MELB | 9 | 3.7 | 4.2 | 0.1 | 0.0 | 1.2 | 0.0 | 2.2 | 4.9 | 0.2 | 2.0 | 0.0 | 0.1 | 1.8 | 0.0 | 0.4 | 0.0 |
| 2021 | 5 | MELB | 11 | 2.6 | 2.1 | 0.3 | 0.0 | 1.1 | 0.1 | 1.5 | 3.5 | 0.5 | 2.8 | 0.0 | 0.0 | 2.0 | 0.0 | 0.3 | 0.0 |
| 2020 | 4 | MELB | 5 | 3.0 | 3.4 | 0.2 | 0.0 | 1.4 | 0.0 | 2.2 | 2.8 | 0.0 | 2.0 | 0.0 | 0.2 | 2.4 | 0.0 | 0.6 | 0.0 |
| Career averages | 40 | 3.2 | 3.1 | 0.3 | 0.0 | 1.5 | 0.1 | 2.0 | 4.1 | 0.2 | 3.1 | 0.0 | 0.1 | 1.9 | 0.0 | 0.4 | 0.0 | ||
Totals
| Year | Season | Club | Games | CP | UCP | i50 | M50 | R50 | T50 | TO | I | CM | 1% | CC | SC | C | B | SI | SG |
|---|---|---|---|---|---|---|---|---|---|---|---|---|---|---|---|---|---|---|---|
| 2025 | 10 | MELB | 6 | 21 | 18 | 3 | 0 | 12 | 0 | 17 | 28 | 1 | 27 | 0 | 0 | 13 | 0 | 3 | 0 |
| 2024 | 9 | MELB | 7 | 27 | 23 | 5 | 0 | 15 | 2 | 13 | 33 | 2 | 33 | 0 | 0 | 12 | 0 | 1 | 0 |
| 2023 | 8 | MELB | 2 | 5 | 4 | 0 | 0 | 3 | 0 | 2 | 7 | 0 | 4 | 0 | 0 | 1 | 0 | 1 | 0 |
| 2022 | 6 | MELB | 9 | 33 | 38 | 1 | 0 | 11 | 0 | 20 | 44 | 2 | 18 | 0 | 1 | 16 | 0 | 4 | 0 |
| 2021 | 5 | MELB | 11 | 29 | 23 | 3 | 0 | 12 | 1 | 16 | 39 | 5 | 31 | 0 | 0 | 22 | 0 | 3 | 0 |
| 2020 | 4 | MELB | 5 | 15 | 17 | 1 | 0 | 7 | 0 | 11 | 14 | 0 | 10 | 0 | 1 | 12 | 0 | 3 | 0 |
| Career totals | 40 | 130 | 123 | 13 | 0 | 60 | 3 | 79 | 165 | 10 | 123 | 0 | 2 | 76 | 0 | 15 | 0 | ||
Home/Away Per Game
| Club | Games | CP | UCP | i50 | M50 | R50 | T50 | TO | I | CM | 1% | CC | SC | C | B | SI | SG | |
|---|---|---|---|---|---|---|---|---|---|---|---|---|---|---|---|---|---|---|
| MELB | Home | 20 | 2.8 | 2.4 | 0.4 | 0.0 | 1.4 | 0.0 | 1.6 | 3.5 | 0.2 | 2.8 | 0.0 | 0.1 | 1.4 | 0.0 | 0.3 | 0.0 |
| MELB | Away | 20 | 3.8 | 3.7 | 0.2 | 0.0 | 1.6 | 0.2 | 2.3 | 4.8 | 0.3 | 3.3 | 0.0 | 0.1 | 2.4 | 0.0 | 0.4 | 0.0 |
Finals Per Game
| Year | Season | Club | Games | CP | UCP | i50 | M50 | R50 | T50 | TO | I | CM | 1% | CC | SC | C | B | SI | SG |
|---|---|---|---|---|---|---|---|---|---|---|---|---|---|---|---|---|---|---|---|
| 2024 | 9 | MELB | 7 | 3.9 | 3.3 | 0.7 | 0.0 | 2.1 | 0.3 | 1.9 | 4.7 | 0.3 | 4.7 | 0.0 | 0.0 | 1.7 | 0.0 | 0.1 | 0.0 |
| 2022 | 6 | MELB | 2 | 4.5 | 6.5 | 0.5 | 0.0 | 1.5 | 0.0 | 2.0 | 6.5 | 0.0 | 4.5 | 0.0 | 0.0 | 2.5 | 0.0 | 0.5 | 0.0 |
| 2021 | 5 | MELB | 2 | 2.5 | 4.0 | 0.0 | 0.0 | 2.0 | 0.0 | 2.5 | 4.5 | 0.5 | 2.5 | 0.0 | 0.0 | 2.0 | 0.0 | 0.0 | 0.0 |
| 2020 | 4 | MELB | 1 | 3.0 | 3.0 | 0.0 | 0.0 | 2.0 | 0.0 | 5.0 | 2.0 | 0.0 | 4.0 | 0.0 | 1.0 | 2.0 | 0.0 | 1.0 | 0.0 |
| Career averages | 12 | 3.7 | 3.9 | 0.5 | 0.0 | 2.0 | 0.2 | 2.2 | 4.8 | 0.2 | 4.2 | 0.0 | 0.1 | 1.9 | 0.0 | 0.2 | 0.0 | ||
Game highs
| Year | Season | Club | Games | CP | UCP | i50 | M50 | R50 | T50 | TO | I | CM | 1% | CC | SC | C | B | SI | SG |
|---|---|---|---|---|---|---|---|---|---|---|---|---|---|---|---|---|---|---|---|
| 2025 | 10 | MELB | 6 | 9 | 5 | 2 | 0 | 6 | 0 | 6 | 10 | 1 | 7 | 0 | 0 | 4 | 0 | 1 | 0 |
| 2024 | 9 | MELB | 7 | 7 | 7 | 2 | 0 | 4 | 1 | 4 | 7 | 1 | 7 | 0 | 0 | 4 | 0 | 1 | 0 |
| 2023 | 8 | MELB | 2 | 3 | 3 | 0 | 0 | 3 | 0 | 2 | 5 | 0 | 2 | 0 | 0 | 1 | 0 | 1 | 0 |
| 2022 | 6 | MELB | 9 | 5 | 8 | 1 | 0 | 2 | 0 | 4 | 8 | 1 | 5 | 0 | 1 | 4 | 0 | 2 | 0 |
| 2021 | 5 | MELB | 11 | 6 | 5 | 1 | 0 | 3 | 1 | 5 | 8 | 1 | 5 | 0 | 0 | 4 | 0 | 1 | 0 |
| 2020 | 4 | MELB | 5 | 5 | 8 | 1 | 0 | 2 | 0 | 5 | 3 | 0 | 4 | 0 | 1 | 4 | 0 | 1 | 0 |
| Career highs | 40 | 9 | 8 | 2 | 0 | 6 | 1 | 6 | 10 | 1 | 7 | 0 | 1 | 4 | 0 | 2 | 0 | ||
Opponent Game highs
| Opponent | Games | CP | UCP | i50 | M50 | R50 | T50 | TO | I | CM | 1% | CC | SC | C | B | SI | SG |
|---|---|---|---|---|---|---|---|---|---|---|---|---|---|---|---|---|---|
| Western Bulldogs | 2 | 5 | 3 | 1 | 0 | 2 | 1 | 1 | 5 | 0 | 2 | 0 | 0 | 2 | 0 | 1 | 0 |
| Fremantle | 5 | 5 | 5 | 0 | 0 | 4 | 0 | 4 | 6 | 0 | 5 | 0 | 0 | 2 | 0 | 1 | 0 |
| Brisbane Lions | 3 | 4 | 5 | 1 | 0 | 3 | 0 | 2 | 5 | 1 | 7 | 0 | 0 | 1 | 0 | 0 | 0 |
| GWS GIANTS | 3 | 3 | 3 | 2 | 0 | 2 | 0 | 5 | 4 | 1 | 4 | 0 | 1 | 2 | 0 | 1 | 0 |
| Carlton | 1 | 3 | 6 | 0 | 0 | 2 | 0 | 1 | 6 | 0 | 0 | 0 | 0 | 0 | 0 | 0 | 0 |
| Collingwood | 2 | 6 | 2 | 0 | 0 | 3 | 0 | 3 | 8 | 1 | 4 | 0 | 0 | 4 | 0 | 0 | 0 |
| Adelaide Crows | 6 | 7 | 8 | 1 | 0 | 2 | 1 | 4 | 8 | 1 | 5 | 0 | 0 | 4 | 0 | 1 | 0 |
| Kangaroos | 3 | 6 | 4 | 0 | 0 | 4 | 0 | 5 | 5 | 1 | 3 | 0 | 0 | 4 | 0 | 0 | 0 |
| Geelong Cats | 2 | 3 | 3 | 1 | 0 | 3 | 0 | 2 | 5 | 1 | 6 | 0 | 0 | 2 | 0 | 1 | 0 |
| Gold Coast SUNS | 3 | 3 | 3 | 1 | 0 | 1 | 0 | 2 | 4 | 1 | 4 | 0 | 0 | 3 | 0 | 2 | 0 |
| West Coast Eagles | 1 | 2 | 3 | 2 | 0 | 0 | 0 | 2 | 4 | 0 | 4 | 0 | 0 | 1 | 0 | 0 | 0 |
| Richmond | 3 | 7 | 3 | 0 | 0 | 3 | 0 | 2 | 7 | 1 | 6 | 0 | 0 | 4 | 0 | 1 | 0 |
| St Kilda | 3 | 3 | 8 | 1 | 0 | 2 | 0 | 2 | 5 | 1 | 5 | 0 | 1 | 2 | 0 | 1 | 0 |
| Essendon | 2 | 3 | 7 | 1 | 0 | 4 | 1 | 4 | 5 | 0 | 7 | 0 | 0 | 3 | 0 | 0 | 0 |
| Port Adelaide | 1 | 9 | 3 | 0 | 0 | 6 | 0 | 6 | 10 | 1 | 7 | 0 | 0 | 4 | 0 | 0 | 0 |
Per Opponent Averages
| Opponent | Games | CP | UCP | i50 | M50 | R50 | T50 | TO | I | CM | 1% | CC | SC | C | B | SI | SG |
|---|---|---|---|---|---|---|---|---|---|---|---|---|---|---|---|---|---|
| Western Bulldogs | 2 | 4.5 | 2.0 | 0.5 | 0.0 | 1.5 | 0.5 | 1.0 | 4.0 | 0.0 | 1.0 | 0.0 | 0.0 | 1.5 | 0.0 | 1.0 | 0.0 |
| Fremantle | 5 | 2.6 | 3.4 | 0.0 | 0.0 | 1.8 | 0.0 | 1.8 | 4.0 | 0.0 | 2.4 | 0.0 | 0.0 | 1.4 | 0.0 | 0.4 | 0.0 |
| Brisbane Lions | 3 | 2.7 | 2.3 | 0.7 | 0.0 | 2.0 | 0.0 | 1.7 | 4.0 | 0.3 | 5.3 | 0.0 | 0.0 | 1.0 | 0.0 | 0.0 | 0.0 |
| GWS GIANTS | 3 | 3.0 | 1.3 | 0.7 | 0.0 | 0.7 | 0.0 | 3.0 | 3.3 | 0.3 | 2.7 | 0.0 | 0.3 | 1.7 | 0.0 | 0.7 | 0.0 |
| Carlton | 1 | 3.0 | 6.0 | 0.0 | 0.0 | 2.0 | 0.0 | 1.0 | 6.0 | 0.0 | 0.0 | 0.0 | 0.0 | 0.0 | 0.0 | 0.0 | 0.0 |
| Collingwood | 2 | 5.0 | 1.5 | 0.0 | 0.0 | 1.5 | 0.0 | 1.5 | 5.5 | 0.5 | 2.5 | 0.0 | 0.0 | 3.5 | 0.0 | 0.0 | 0.0 |
| Adelaide Crows | 6 | 3.5 | 4.3 | 0.3 | 0.0 | 1.0 | 0.2 | 2.3 | 4.7 | 0.2 | 2.5 | 0.0 | 0.0 | 2.7 | 0.0 | 0.2 | 0.0 |
| Kangaroos | 3 | 4.0 | 3.3 | 0.0 | 0.0 | 2.3 | 0.0 | 2.7 | 4.3 | 0.3 | 1.7 | 0.0 | 0.0 | 2.7 | 0.0 | 0.0 | 0.0 |
| Geelong Cats | 2 | 3.0 | 2.5 | 0.5 | 0.0 | 1.5 | 0.0 | 2.0 | 4.0 | 0.5 | 4.0 | 0.0 | 0.0 | 1.5 | 0.0 | 0.5 | 0.0 |
| Gold Coast SUNS | 3 | 2.3 | 2.0 | 0.3 | 0.0 | 0.3 | 0.0 | 1.0 | 2.3 | 0.3 | 2.0 | 0.0 | 0.0 | 2.0 | 0.0 | 1.3 | 0.0 |
| West Coast Eagles | 1 | 2.0 | 3.0 | 2.0 | 0.0 | 0.0 | 0.0 | 2.0 | 4.0 | 0.0 | 4.0 | 0.0 | 0.0 | 1.0 | 0.0 | 0.0 | 0.0 |
| Richmond | 3 | 4.0 | 2.0 | 0.0 | 0.0 | 1.3 | 0.0 | 1.3 | 4.0 | 0.3 | 4.0 | 0.0 | 0.0 | 1.3 | 0.0 | 0.3 | 0.0 |
| St Kilda | 3 | 1.7 | 3.7 | 0.3 | 0.0 | 1.0 | 0.0 | 1.3 | 3.0 | 0.3 | 3.7 | 0.0 | 0.3 | 1.7 | 0.0 | 0.7 | 0.0 |
| Essendon | 2 | 2.0 | 6.0 | 0.5 | 0.0 | 2.5 | 0.5 | 2.5 | 3.5 | 0.0 | 6.0 | 0.0 | 0.0 | 2.0 | 0.0 | 0.0 | 0.0 |
| Port Adelaide | 1 | 9.0 | 3.0 | 0.0 | 0.0 | 6.0 | 0.0 | 6.0 | 10.0 | 1.0 | 7.0 | 0.0 | 0.0 | 4.0 | 0.0 | 0.0 | 0.0 |
Per Venue Averages
| Opponent | Games | CP | UCP | i50 | M50 | R50 | T50 | TO | I | CM | 1% | CC | SC | C | B | SI | SG |
|---|---|---|---|---|---|---|---|---|---|---|---|---|---|---|---|---|---|
| Mission Whitten Oval | 2 | 4.5 | 2.0 | 0.5 | 0.0 | 1.5 | 0.5 | 1.0 | 4.0 | 0.0 | 1.0 | 0.0 | 0.0 | 1.5 | 0.0 | 1.0 | 0.0 |
| Alberton Oval | 1 | 9.0 | 3.0 | 0.0 | 0.0 | 6.0 | 0.0 | 6.0 | 10.0 | 1.0 | 7.0 | 0.0 | 0.0 | 4.0 | 0.0 | 0.0 | 0.0 |
| Swinburne Centre | 1 | 4.0 | 3.0 | 0.0 | 0.0 | 1.0 | 0.0 | 2.0 | 4.0 | 1.0 | 3.0 | 0.0 | 0.0 | 4.0 | 0.0 | 0.0 | 0.0 |
| Marvel Stadium | 1 | 4.0 | 1.0 | 0.0 | 0.0 | 0.0 | 0.0 | 0.0 | 3.0 | 0.0 | 1.0 | 0.0 | 0.0 | 4.0 | 0.0 | 0.0 | 0.0 |
| Fremantle Oval | 3 | 1.7 | 3.7 | 0.0 | 0.0 | 1.7 | 0.0 | 1.3 | 3.3 | 0.0 | 3.3 | 0.0 | 0.0 | 1.7 | 0.0 | 0.3 | 0.0 |
| Optus Stadium | 1 | 5.0 | 3.0 | 0.0 | 0.0 | 1.0 | 0.0 | 4.0 | 6.0 | 0.0 | 0.0 | 0.0 | 0.0 | 1.0 | 0.0 | 1.0 | 0.0 |
| GMHBA Stadium | 2 | 3.0 | 2.5 | 0.5 | 0.0 | 1.5 | 0.0 | 2.0 | 4.0 | 0.5 | 4.0 | 0.0 | 0.0 | 1.5 | 0.0 | 0.5 | 0.0 |
| Windy Hill | 1 | 3.0 | 7.0 | 1.0 | 0.0 | 4.0 | 1.0 | 1.0 | 5.0 | 0.0 | 7.0 | 0.0 | 0.0 | 1.0 | 0.0 | 0.0 | 0.0 |
| RSEA Park | 1 | 1.0 | 8.0 | 0.0 | 0.0 | 1.0 | 0.0 | 2.0 | 3.0 | 0.0 | 4.0 | 0.0 | 0.0 | 2.0 | 0.0 | 1.0 | 0.0 |
| Casey Fields | 17 | 2.8 | 2.3 | 0.4 | 0.0 | 1.4 | 0.0 | 1.5 | 3.5 | 0.2 | 2.6 | 0.0 | 0.1 | 1.3 | 0.0 | 0.3 | 0.0 |
| Norwood Oval | 2 | 5.0 | 5.0 | 0.5 | 0.0 | 1.0 | 0.5 | 3.5 | 5.5 | 0.0 | 2.0 | 0.0 | 0.0 | 3.5 | 0.0 | 0.0 | 0.0 |
| MCG | 1 | 4.0 | 5.0 | 1.0 | 0.0 | 2.0 | 0.0 | 2.0 | 5.0 | 0.0 | 4.0 | 0.0 | 0.0 | 1.0 | 0.0 | 0.0 | 0.0 |
| ENGIE Stadium | 1 | 3.0 | 3.0 | 0.0 | 0.0 | 2.0 | 0.0 | 5.0 | 2.0 | 0.0 | 4.0 | 0.0 | 1.0 | 2.0 | 0.0 | 1.0 | 0.0 |
| IKON Park | 2 | 2.0 | 2.5 | 1.0 | 0.0 | 0.5 | 0.0 | 3.0 | 3.0 | 0.5 | 4.0 | 0.0 | 0.0 | 2.0 | 0.0 | 0.5 | 0.0 |
| Adelaide Oval | 2 | 3.5 | 6.5 | 0.0 | 0.0 | 1.0 | 0.0 | 3.0 | 6.5 | 0.5 | 4.0 | 0.0 | 0.0 | 3.5 | 0.0 | 0.5 | 0.0 |
| Victoria Park | 1 | 6.0 | 2.0 | 0.0 | 0.0 | 3.0 | 0.0 | 3.0 | 8.0 | 1.0 | 4.0 | 0.0 | 0.0 | 3.0 | 0.0 | 0.0 | 0.0 |
| People First Stadium | 1 | 3.0 | 1.0 | 0.0 | 0.0 | 0.0 | 0.0 | 0.0 | 4.0 | 1.0 | 4.0 | 0.0 | 0.0 | 3.0 | 0.0 | 1.0 | 0.0 |
Venue Game highs
| Opponent | Games | CP | UCP | i50 | M50 | R50 | T50 | TO | I | CM | 1% | CC | SC | C | B | SI | SG |
|---|---|---|---|---|---|---|---|---|---|---|---|---|---|---|---|---|---|
| Mission Whitten Oval | 2 | 5 | 3 | 1 | 0 | 2 | 1 | 1 | 5 | 0 | 2 | 0 | 0 | 2 | 0 | 1 | 0 |
| Alberton Oval | 1 | 9 | 3 | 0 | 0 | 6 | 0 | 6 | 10 | 1 | 7 | 0 | 0 | 4 | 0 | 0 | 0 |
| Swinburne Centre | 1 | 4 | 3 | 0 | 0 | 1 | 0 | 2 | 4 | 1 | 3 | 0 | 0 | 4 | 0 | 0 | 0 |
| Marvel Stadium | 1 | 4 | 1 | 0 | 0 | 0 | 0 | 0 | 3 | 0 | 1 | 0 | 0 | 4 | 0 | 0 | 0 |
| Fremantle Oval | 3 | 3 | 5 | 0 | 0 | 4 | 0 | 2 | 4 | 0 | 5 | 0 | 0 | 2 | 0 | 1 | 0 |
| Optus Stadium | 1 | 5 | 3 | 0 | 0 | 1 | 0 | 4 | 6 | 0 | 0 | 0 | 0 | 1 | 0 | 1 | 0 |
| GMHBA Stadium | 2 | 3 | 3 | 1 | 0 | 3 | 0 | 2 | 5 | 1 | 6 | 0 | 0 | 2 | 0 | 1 | 0 |
| Windy Hill | 1 | 3 | 7 | 1 | 0 | 4 | 1 | 1 | 5 | 0 | 7 | 0 | 0 | 1 | 0 | 0 | 0 |
| RSEA Park | 1 | 1 | 8 | 0 | 0 | 1 | 0 | 2 | 3 | 0 | 4 | 0 | 0 | 2 | 0 | 1 | 0 |
| Casey Fields | 17 | 7 | 6 | 2 | 0 | 4 | 0 | 5 | 7 | 1 | 7 | 0 | 1 | 4 | 0 | 2 | 0 |
| Norwood Oval | 2 | 7 | 6 | 1 | 0 | 2 | 1 | 4 | 7 | 0 | 2 | 0 | 0 | 4 | 0 | 0 | 0 |
| MCG | 1 | 4 | 5 | 1 | 0 | 2 | 0 | 2 | 5 | 0 | 4 | 0 | 0 | 1 | 0 | 0 | 0 |
| ENGIE Stadium | 1 | 3 | 3 | 0 | 0 | 2 | 0 | 5 | 2 | 0 | 4 | 0 | 1 | 2 | 0 | 1 | 0 |
| IKON Park | 2 | 3 | 5 | 2 | 0 | 1 | 0 | 4 | 4 | 1 | 5 | 0 | 0 | 3 | 0 | 1 | 0 |
| Adelaide Oval | 2 | 5 | 8 | 0 | 0 | 1 | 0 | 4 | 8 | 1 | 5 | 0 | 0 | 4 | 0 | 1 | 0 |
| Victoria Park | 1 | 6 | 2 | 0 | 0 | 3 | 0 | 3 | 8 | 1 | 4 | 0 | 0 | 3 | 0 | 0 | 0 |
| People First Stadium | 1 | 3 | 1 | 0 | 0 | 0 | 0 | 0 | 4 | 1 | 4 | 0 | 0 | 3 | 0 | 1 | 0 |
Premierships